The U.S. Foreclosure Map You Need to See 🏡
Despite rising headlines about economic strain, foreclosure remains rare in today’s housing market. A recent foreclosure snapshot beautifully illustrates the current landscape—and why it’s worth paying attention.
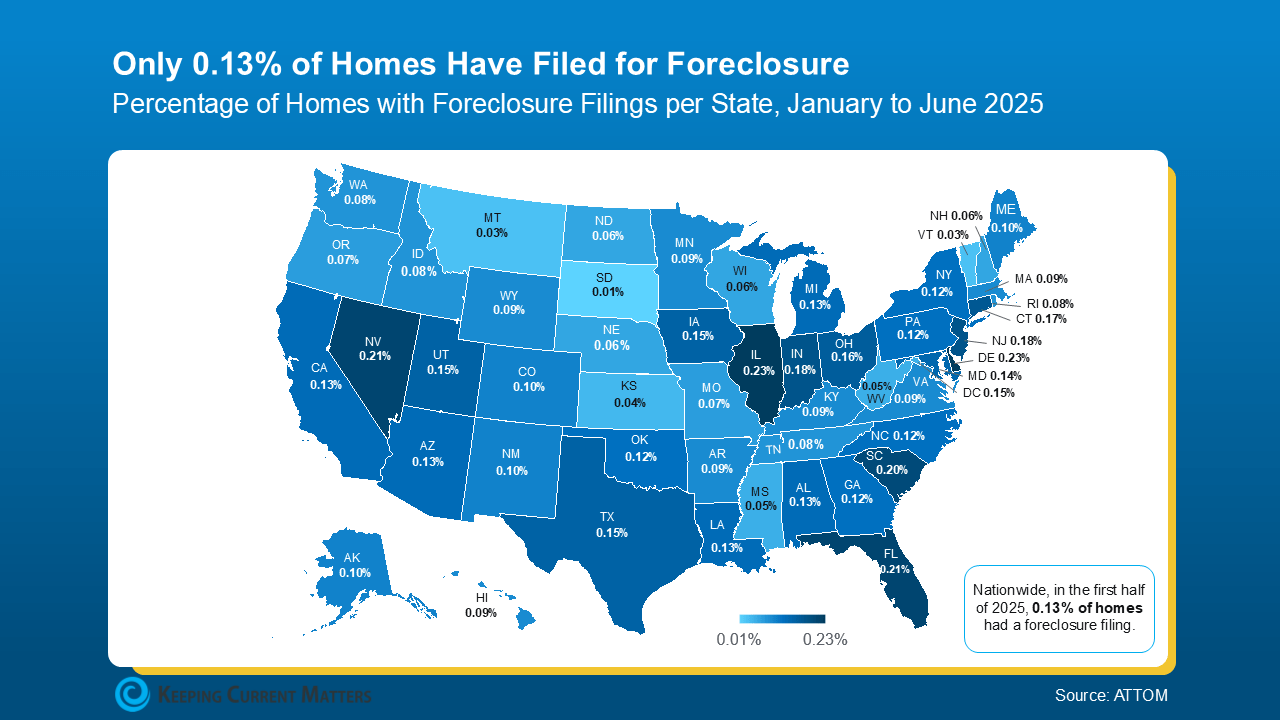
📉 Foreclosures Are Still Extremely Low
-
In the first half of 2025, only 0.13% of homes nationwide had a foreclosure filing—that’s just 1 in every 758 homes. This is a stark contrast to the peak of the 2008 crash, when foreclosures hit 1 in 45 homes MortgageOrb+5Keeping Current Matters+5Keeping Current Matters+5.
-
Overall filings are still far below levels seen during prior crises, indicating a stable housing market.
📍 State-Level Breakdown: The Hotspots
While national numbers remain low, foreclosures vary across regions:
-
Delaware, Nevada, Illinois, Indiana, and Connecticut continue to have the highest foreclosure rates per housing unit gabbytaylorgroup.com+2Keeping Current Matters+2Keeping Current Matters+2Investopedia+4Nolo+4ATTOM+4.
-
In June 2025, states with the greatest foreclosure activity included South Carolina (1 per 2,426 homes), Nevada, Florida, Illinois, and Delaware ATTOM+1ATTOM+1.
⚠️ Watch for “Zombie Foreclosures”
-
A unique phenomenon: “zombie foreclosures,” where homeowners abandon properties before the foreclosure process completes. These are still very rare, but some states—like Missouri, Michigan, South Carolina, Indiana, and Kansas—saw upticks in early 2025 Denver Realtor+11The Sun+11ATTOM+11.
-
Even in these regions, such cases represent only a small fraction of homes.
💪 Why Foreclosures Remain Low
-
Stronger lending standards prevent risky lending that fueled the 2008 crash.
-
Many homeowners have significant equity, allowing them to sell instead of default Keeping Current Matters.
-
Monthly housing costs remain manageable for most borrowers, and loan delinquency rates have stayed below crisis levels MarketWatch.
🏡 What This Means for Homeowners and Buyers
-
For homeowners: the low foreclosure numbers suggest stability, not crisis. It’s still a landlord’s or seller’s market in most areas.
-
For buyers: this isn’t the time to expect foreclosure deals like in 2008. Foreclosure inventory remains limited, and distressed sales aren’t flooding the market.
-
Still, it’s always smart to watch local trends—markets vary, and some areas will naturally see more activity than others.
✅ Bottom Line
The U.S. foreclosure map is a reassuring sign: crash-level risk remains distant. Yes, filings are up slightly in some states, but overall activity remains well below historical norms. That’s good news for stability-minded homeowners and buyers alike.
Curious about your local foreclosure trends? Let’s connect. We can help you understand what the numbers mean for your market—and your next real estate decision.

Providing guidance and assisting motivated buyers, sellers, tenants, landlords, and investors in marketing and purchasing property for the right price under the best terms. Determining clients’ needs and financial ability to purchase the best home for them. Call me today and let me help you find a home that can change your life!