
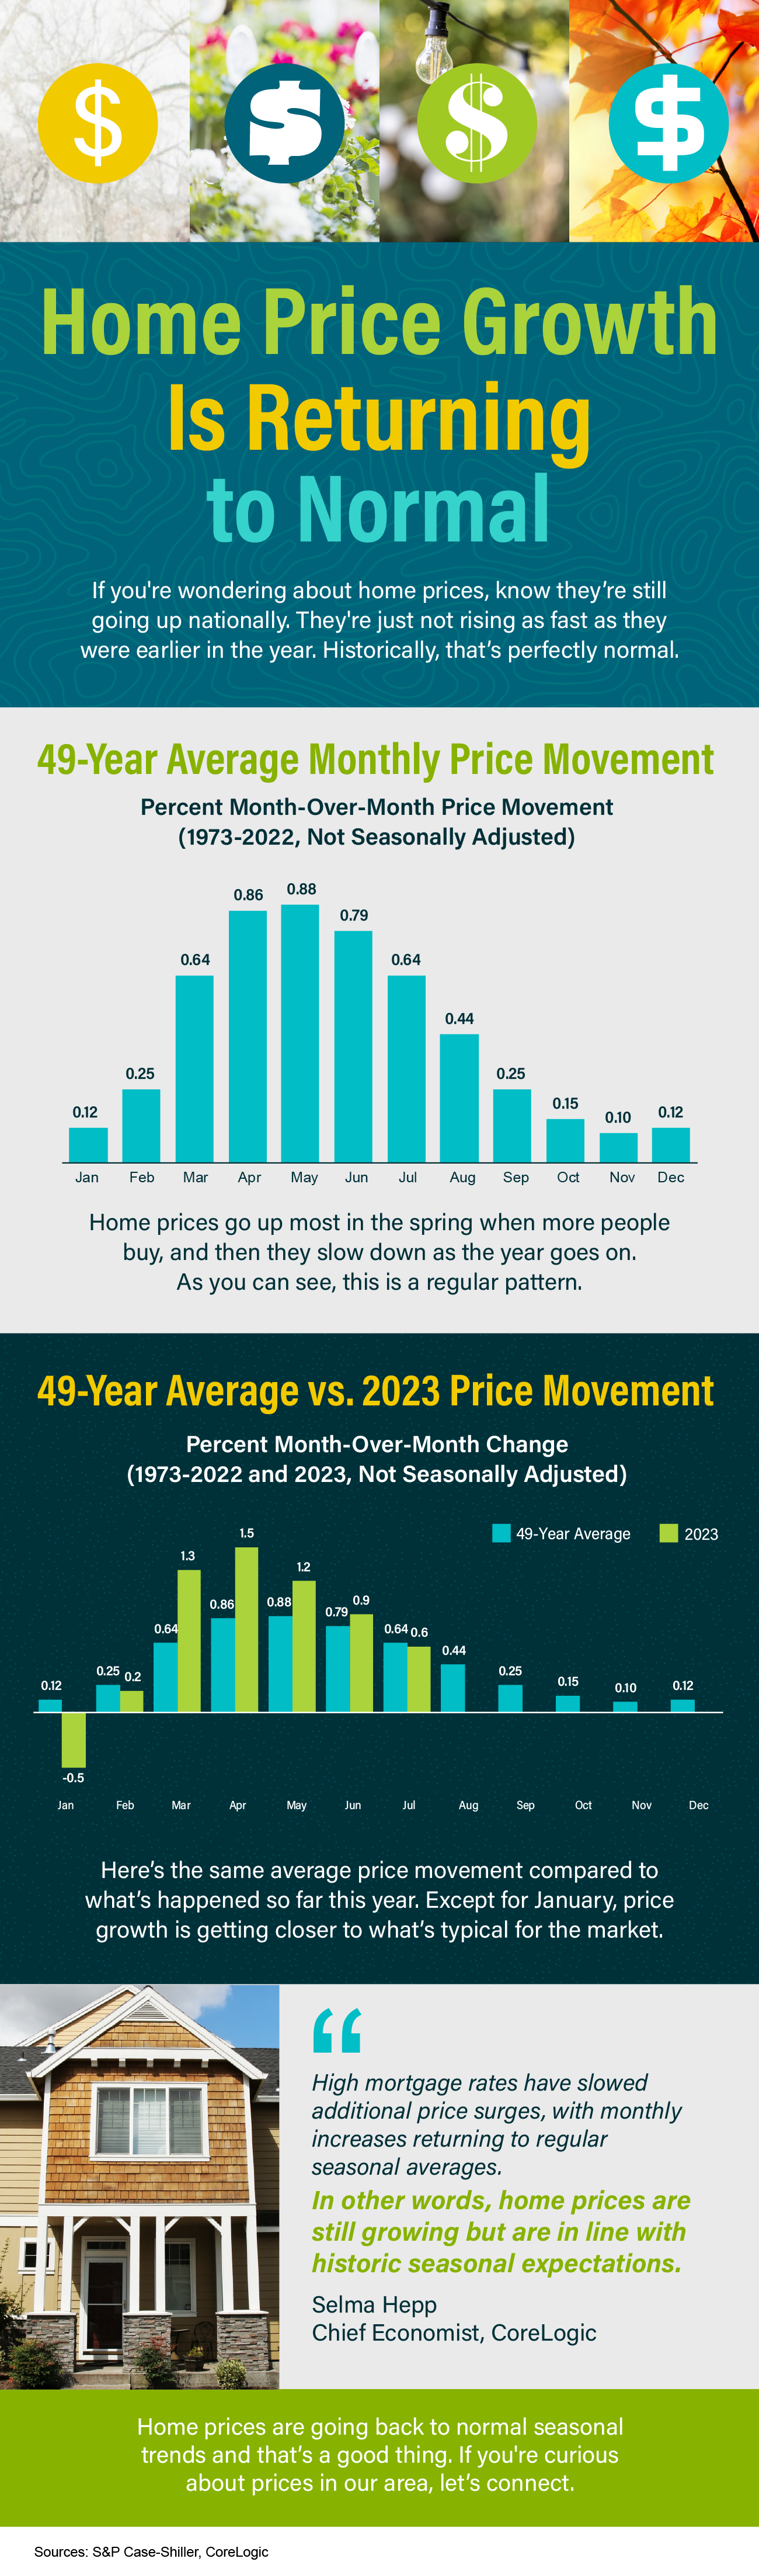
For most of the past two years the story on home price growth has been deceleration. Prices still rising, but slowly, and slowing further. That story was accurate. It also appears to have ended about four months ago, and almost nobody has noticed.
Two data points, same source, four months apart, tell the whole thing.
What home price growth actually did this spring
In February, the national median existing-home price was $398,000, up 0.3% year over year. That is as close to flat as a housing market gets, and it is where the “prices have stalled” coverage came from.
By June, the national median was $440,600, up 1.8%.
Annual growth went from 0.3% to 1.8% in four months. Still modest in absolute terms, but it is six times the February rate and it is moving in the opposite direction from the narrative.
That is what “home price growth slowed down, and that may be changing” looks like in actual numbers rather than in a forecast.
Why home price growth slowed, and why it stopped
The mechanism matters more than the number, because it tells you whether to expect the same thing locally.
Prices decelerate when supply catches up with demand. That is essentially the whole explanation for 2024 and 2025. Inventory climbed off historic lows, buyers got more to choose from, sellers lost leverage, and growth flattened.
So the obvious question is what inventory did next. In June, total national inventory stood at 1.56 million units — up just 1.3% from a year earlier, and down from May. Months of supply came in at 4.6, exactly where it was a year before.
Supply stopped growing. Price growth stopped slowing. Those are the same fact described twice.
Which reframes what to watch. If you want to know where prices are heading, months of supply is the leading indicator and the price index is the lagging one.
The Northeast never really participated
Here is the part that matters most for anyone reading this from Monmouth or Ocean County. It is also why a changed forecast moves your timeline rather than your plan.
While the national figure was crawling at 0.3% in February, the Northeast median was up 3.3%. By June, the Northeast was at $564,800, up 3.9%.
So the region did not decelerate the way the country did, and it did not need to reaccelerate. It has been running between three and four percent through the entire period when national coverage was describing a stall.
That gap is the single most useful thing to know about reading housing news here, and it is why I keep coming back to it. I went through the mechanics of the problem in the piece on what home price headlines miss about this county.
Monmouth’s supply picture is the reason
If supply explains price growth, then local supply explains local price growth, and ours looks nothing like the national figure.
National months of supply in June: 4.6. Monmouth County single-family in June: about 2.7. Townhouse and condo: about 2.4.
That is not a modest difference. It is the difference between a market where buyers have options and one where they are competing, which is why sellers here were averaging slightly over asking while the national story was about negotiating room. I laid out the detail in the Monmouth and Ocean comparison, and the gap between the two counties is worth knowing too.
Ocean County sits looser than Monmouth, which is the closest thing to the national pattern that exists in this area. Even there it is not 4.6 months.
What home price growth means if you are selling
Mostly it means the window people keep waiting for probably is not coming.
A lot of would-be sellers have been holding on the theory that flat prices mean they should wait for the next upcycle. The data says the regional number never flattened, so there was nothing to wait out, and the national number has now turned up as well.
It does not mean price aggressively. Reaccelerating growth of 1.8% nationally and 3.9% regionally is normal appreciation, not a boom, and overpricing into it still gets punished. The error I see most often is pricing off a market-wide figure instead of actual comparables, which I wrote about in why the average is a trap.
What it means if you are buying
The national narrative of softening prices and patient buyers is real, and it is describing the South and the mountain West.
Here, waiting has a cost. At 3.9% regional appreciation, a $700,000 house gains about $27,000 in a year. If you are waiting for a rate improvement, that is the number the rate drop has to beat.
That said, room exists locally — it is just specific rather than general. It is in the listings that have been sitting, in certain towns and price bands, and in Ocean County more than Monmouth. I went through where to find it in the piece on homes that have been on the market a while.
The bottom line
National home price growth bottomed out around 0.3% in February and has climbed to 1.8% by June, and the reason is simply that inventory stopped expanding.
The Northeast never went through that cycle. We have been in the three-to-four percent range throughout, on roughly 2.7 months of supply against the national 4.6.
The practical takeaway is to stop reading the national price index as a forecast for this market and start watching local months of supply instead. When that number moves here, prices will follow. It has not moved yet.
If you want the current supply and percent-of-list figures for your specific town and price band, get in touch and I will pull them.
Thinking about selling? You can request a valuation on your home here, and I am glad to go through it with you and tell you what I think it would actually sell for.
Ready to look? You can search every listing in the area here, straight from the MLS and updated continuously.
National and regional figures reflect National Association of Realtors existing-home sales reports for February and June 2026. Local months-of-supply figures reflect Monmouth County MLS data for June 2026 and vary by town, price band, and property type. Year-over-year median price changes reflect the mix of what sold and are not a valuation of any individual home. For figures specific to your property, ask for a current comparative market analysis.

Shea Merritt is a licensed New Jersey real estate agent with eXp Realty, working with buyers and sellers across Middlesex, Monmouth, and Ocean counties. He grew up in Old Bridge. He writes here about the arithmetic behind a move: what a house would actually bring today, what the tax line does to a monthly payment, and how to compare offers on their terms rather than on the top number. If you are weighing a sale or a purchase, send him the address and he will run the numbers on it.